Results
Across the 12-week period, the recorded measures moved in a consistent direction in this group of ten participants: pain decreased, physical function and mobility improved, and inflammatory markers fell. The charts below show the group averages (means) for all ten participants at each timepoint. Because this was a single-group study with no control arm, these charts show change over time within the treated group — not a comparison against an untreated or placebo group.
Charts show group means (n=10). Single-group data showing change over time, not a controlled comparison.
Pain (VAS, 0–10). Average pain scores declined steadily over the 12 weeks. For example, one participant's right-knee score moved from 9.5 at baseline to 5.5 at week 12; across the group, the downward trend was consistent.
Physical function (WOMAC, 0–68). WOMAC scores, where lower indicates better function, decreased across all ten participants from baseline to week 12.
Mobility (knee flexion). Average knee flexion increased over the study period — right-knee flexion rose from roughly 110–118° at baseline to higher values by week 12, with a similar pattern in the left knee.
Inflammation (CRP and ESR). Both inflammatory markers decreased between the baseline and follow-up blood draws — average ESR fell from about 11.2 to 8.4 mm/h and average CRP from about 4.5 to 2.3 mg/L.
A Note on Imaging
The study also recorded MRI scans. The three images below are reproduced from the study's supplementary material and show baseline and 12-week scans for a single participant (Patient 3).
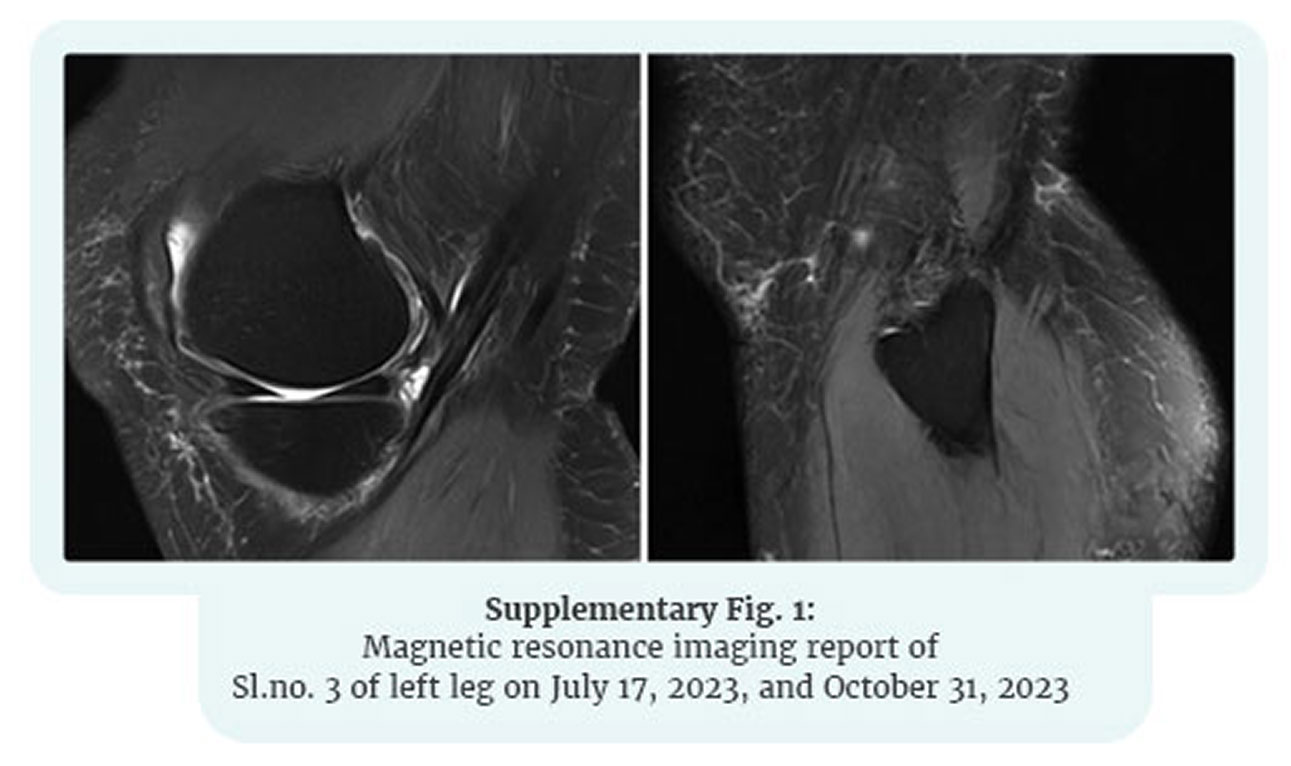
Supplementary Fig. 1 — Patient 3, baseline vs 12 weeks
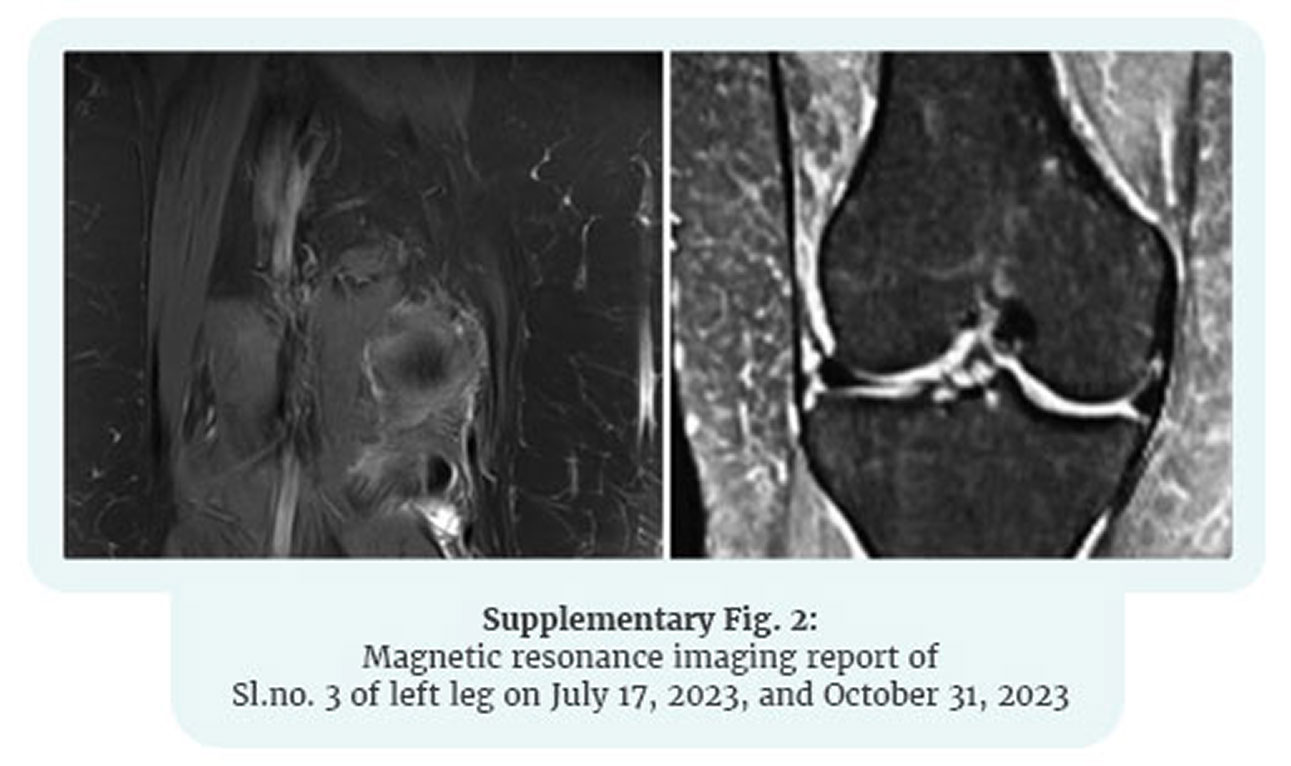
Supplementary Fig. 2 — Patient 3, baseline vs 12 weeks
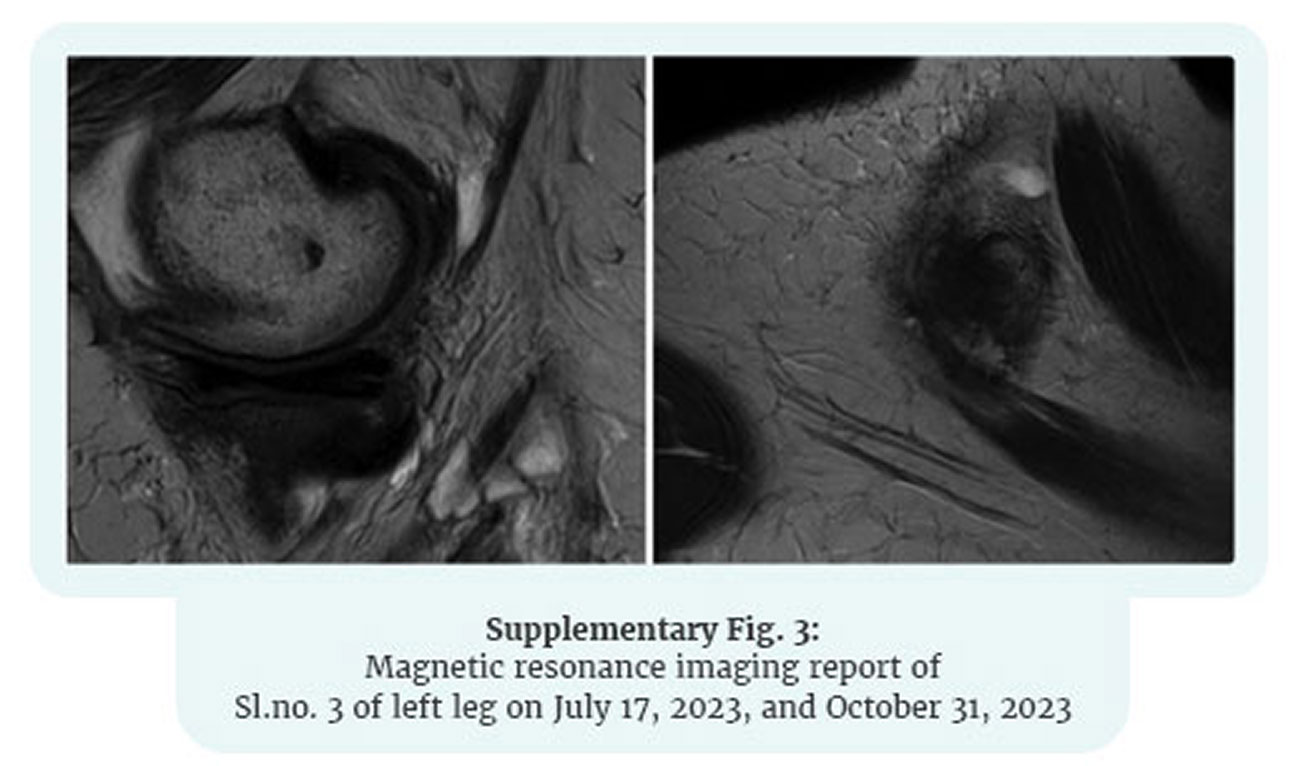
Supplementary Fig. 3 — Patient 3, baseline vs 12 weeks
Supplementary Fig. 1 — Patient 3, baseline vs 12 weeks
Supplementary Fig. 2 — Patient 3, baseline vs 12 weeks
Supplementary Fig. 3 — Patient 3, baseline vs 12 weeks
The published study did not perform quantitative cartilage measurement on these images, and findings from one participant cannot be generalized. They are included here for transparency and are best understood as illustrative and hypothesis-generating — pointing to the value of a properly designed imaging study — rather than as evidence of cartilage repair or regeneration.
↑ Back to contents